Every widely noticed US release, one row each
Did a film make its year's top 40 at the US box office? Each year about 37 films in the list did and about 130 didn't, so every hit is compared with its own year. The hit rate, 22.2%, is almost the same as the song study's 23.1%.
The story (47)
Genres, sequel or remake, source, audience, tone, setting, spectacle, lead, ending, romance, running time, rating. Coded for every film from general knowledge, blind to box office.
The package (7)
Budget, major studio, summer / holiday / off-season release, US production.
The people (4)
The lead star's and director's previous top-40 hits and non-hits, counted before release.
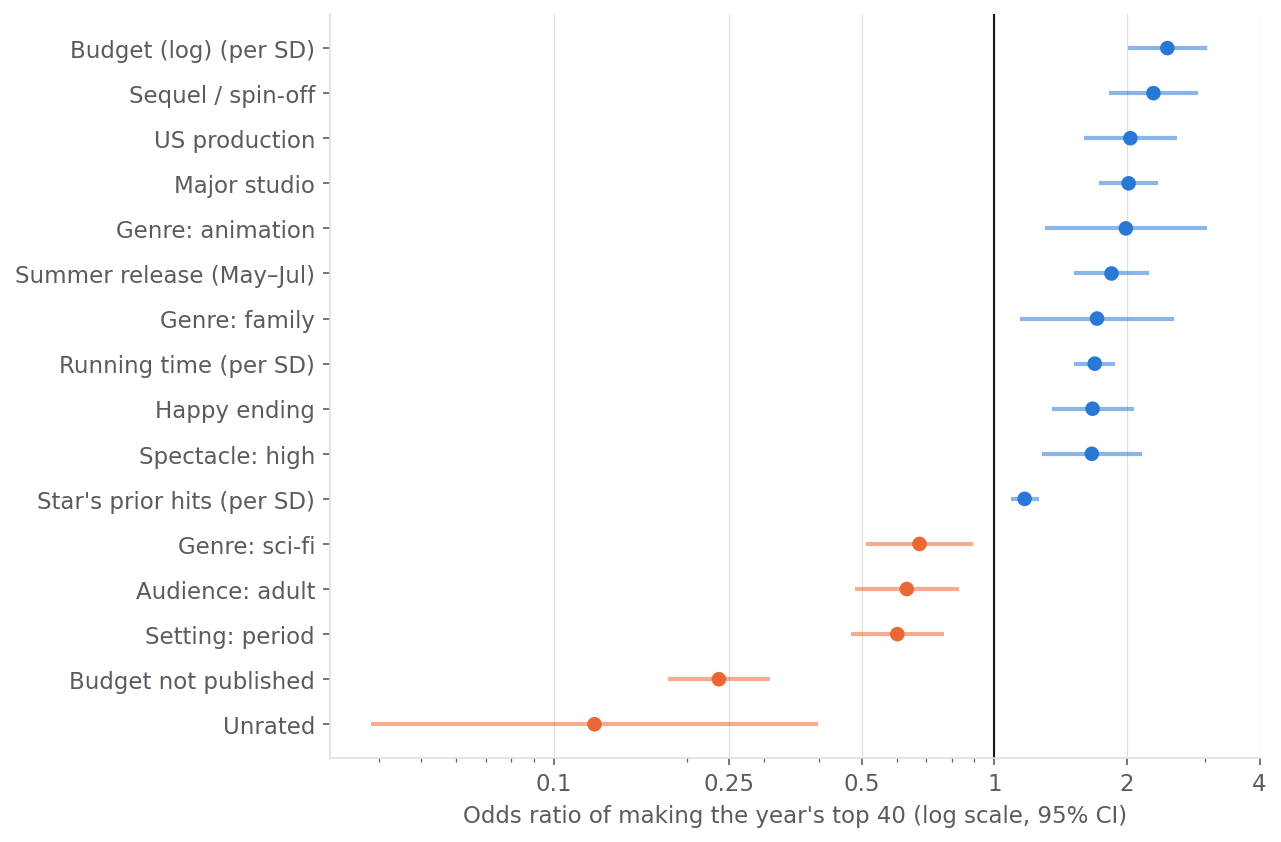
Money and machinery first, then a big, happy story
Logistic regression with a fixed effect for each year and standard errors clustered by lead star. Only features that survive Benjamini–Hochberg correction are listed. "Budget not published" is partly a consequence of success, because hits get their budgets reported, so read it as a caveat, not a lever.
| Feature | Odds ratio | 95% CI | Unit |
|---|---|---|---|
| Budget (log) | 2.47 | 2.01–3.04 | per SD |
| Sequel / spin-off | 2.30 | 1.82–2.89 | yes vs no |
| US production | 2.04 | 1.60–2.59 | yes vs no |
| Major studio | 2.02 | 1.73–2.35 | yes vs no |
| Genre: animation | 1.99 | 1.30–3.04 | yes vs no |
| Summer release (May–Jul) | 1.84 | 1.52–2.24 | yes vs no |
| Genre: family | 1.71 | 1.14–2.56 | yes vs no |
| Running time | 1.69 | 1.52–1.88 | per SD |
| Happy ending | 1.67 | 1.35–2.07 | yes vs no |
| Spectacle: high | 1.66 | 1.28–2.16 | yes vs no |
| Star's prior hits | 1.17 | 1.09–1.26 | per SD |
| Genre: sci-fi | 0.68 | 0.51–0.89 | yes vs no |
| Audience: adult | 0.63 | 0.48–0.83 | yes vs no |
| Setting: period | 0.60 | 0.47–0.77 | yes vs no |
| Budget not published | 0.24 | 0.18–0.31 | yes vs no |
| Unrated | 0.12 | 0.04–0.40 | yes vs no |
Picks the bigger hit six times in seven
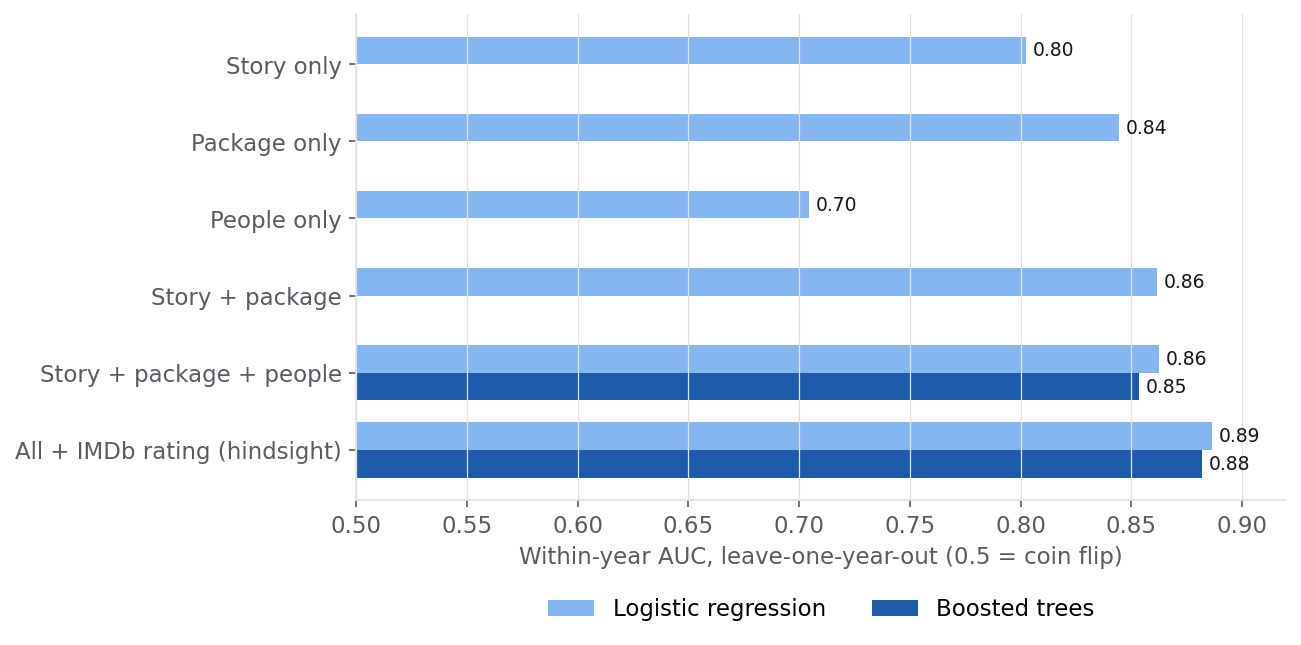
Every film was scored by a model trained on the other 39 years. Within a year, the full model ranks a real hit above a non-hit 86% of the time. The song model managed 65%. The IMDb rating is hindsight, because audiences rate films after seeing them, so it's reported separately.
| Features | Logistic | Boosted trees |
|---|---|---|
| Story only | 0.803 | |
| Package only | 0.845 | |
| People only | 0.704 | |
| Story + package | 0.862 | |
| Story + package + people | 0.862 | 0.854 |
| All + IMDb rating (hindsight) | 0.886 | 0.882 |
Is it just the money?
Budget does most of the work, but the story stands up on its own. Among films with a published budget, budget alone scores 0.80 and the story alone 0.79; together, 0.84. Dropping the leaky "budget not published" flag leaves 0.85. Among studio-scale films only, the full model scores 0.80.
| Check | Films | Within-year AUC |
|---|---|---|
| Content: factual codes only (genre, sequel/remake, source, rating, runtime) | 6,707 | 0.776 |
| Content: judgement codes only (audience, tone, setting, spectacle, lead, ending, romance) | 6,707 | 0.747 |
| Studio-scale films only (major studio, or published budget >= year median): all three | 3,589 | 0.801 |
| Studio-scale films only: content only | 3,589 | 0.749 |
| Hit = top 20 (not top 40): all three | 6,707 | 0.886 |
| Hit = top 60: all three | 6,707 | 0.847 |
| Without the "budget not published" flag | 6,707 | 0.851 |
| Published budget only: all features / budget alone / story alone | 5,112 | 0.839 / 0.799 / 0.785 |
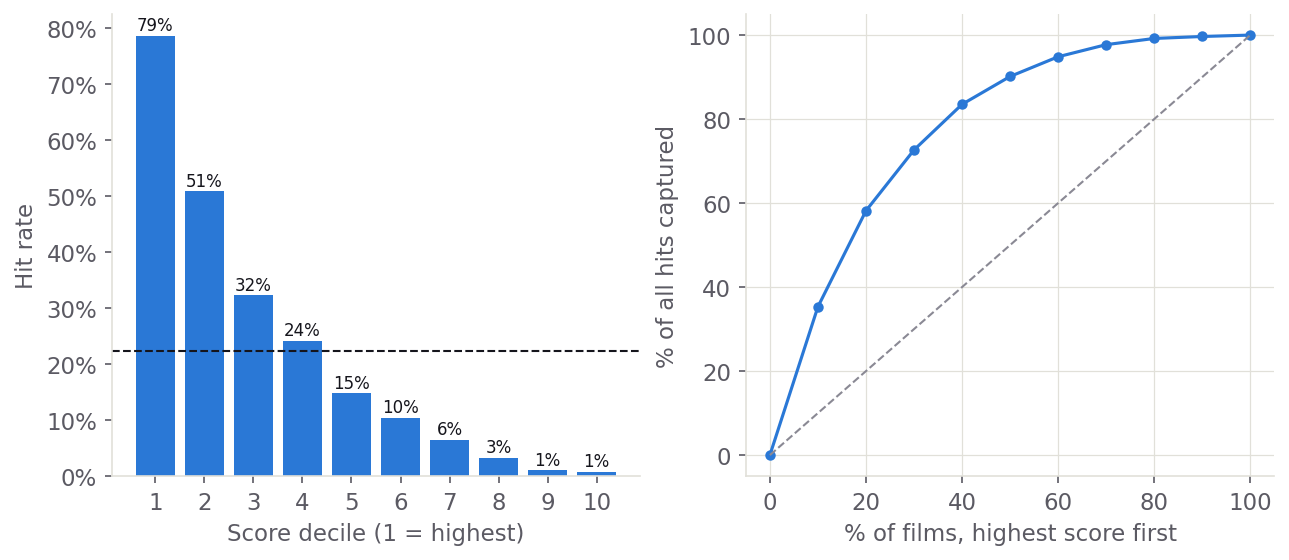
The top-scored 10% of films are hits 79% of the time
| Decile | Films | Hits | Hit rate | Lift | Cumulative % of hits |
|---|---|---|---|---|---|
| 1 | 671 | 527 | 78.5% | 3.53× | 35% |
| 2 | 671 | 341 | 50.8% | 2.28× | 58% |
| 3 | 670 | 216 | 32.2% | 1.45× | 73% |
| 4 | 671 | 162 | 24.1% | 1.09× | 84% |
| 5 | 671 | 99 | 14.8% | 0.66× | 90% |
| 6 | 670 | 70 | 10.4% | 0.47× | 95% |
| 7 | 671 | 43 | 6.4% | 0.29× | 98% |
| 8 | 670 | 22 | 3.3% | 0.15× | 99% |
| 9 | 671 | 7 | 1.0% | 0.05× | 100% |
| 10 | 671 | 5 | 0.7% | 0.03× | 100% |
Budget matters more every decade; spectacle matters less
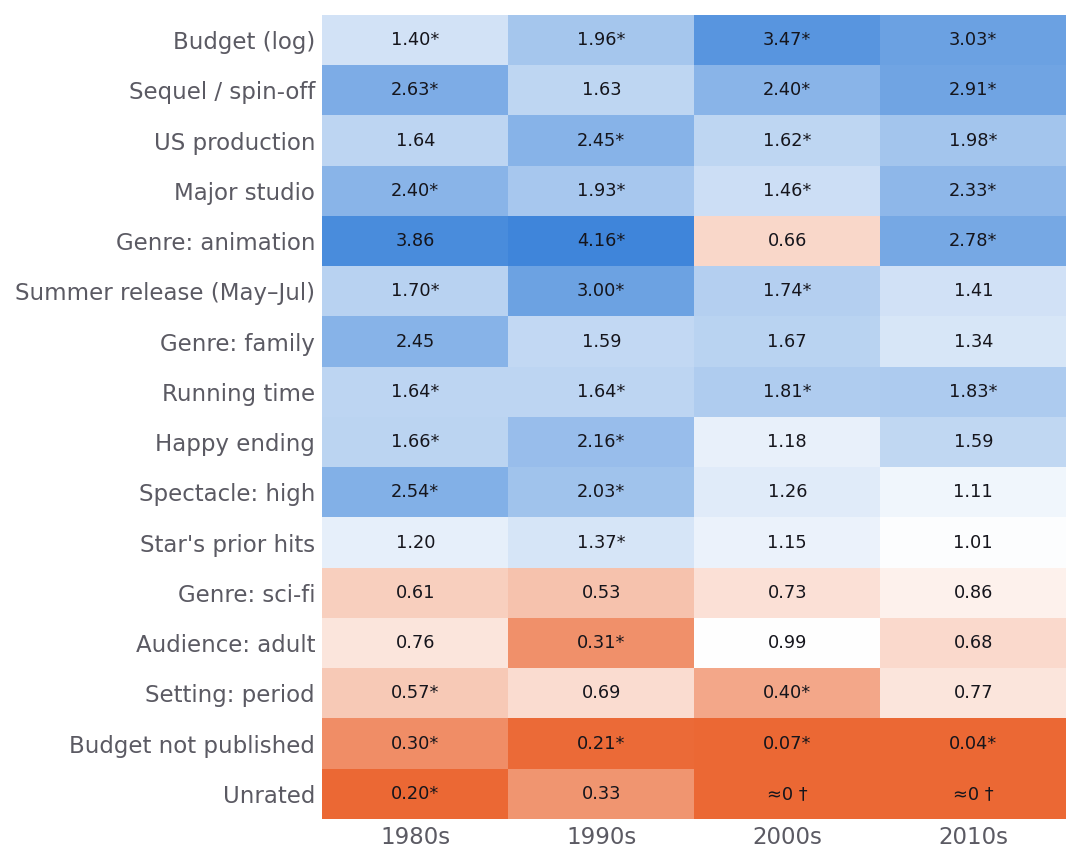
Money became destiny
Budget's odds ratio per SD went from 1.4 in the 1980s to 3.47 in the 2000s and 3.03 in the 2010s.
Spectacle stopped standing out
2.54 in the 1980s, 1.11 by the 2010s, once nearly every big film had it.
Sequels never went out of style
2.63 in the 1980s, 2.91 in the 2010s. Romance went from 1.93 in the 1990s to 0.46.
The model's ten favourites: 9 hits and one famous flop
The template is a big-budget summer family sequel from a major studio. The one miss is Heaven's Gate (1981), the $44m western that nearly sank United Artists. The model saw a big, long, prestigious studio epic, just as its backers did.
| # | Film | Top 40? | Franchise | Budget | Logline |
|---|---|---|---|---|---|
| 1 | The Blues Brothers (1980) | Yes, #9 | started one | $27m | Two musicians on a mission from God. |
| 2 | Toy Story 3 (2010) | Yes, #2 | sequel | $200m | The toys face being left behind as Andy grows up |
| 3 | Angels & Demons (2009) | Yes, #21 | sequel | $150m | A secret society threatens to destroy the Vatican during a conclave. |
| 4 | Mission: Impossible - Fallout (2018) | Yes, #8 | sequel | $178m | Ethan Hunt races to stop a nuclear attack after a mission fails. |
| 5 | Avengers: Endgame (2019) | Yes, #1 | sequel | $356m | The Avengers' final battle to undo Thanos's snap. |
| 6 | Heaven's Gate (1981) | No | original | $44m | The Johnson County War between settlers and barons. |
| 7 | Toy Story 4 (2019) | Yes, #3 | sequel | $200m | Woody meets a spork toy and an old friend. |
| 8 | Superman II (1981) | Yes, #2 | sequel | $54m | Superman loses his powers as super-villains invade |
| 9 | Incredibles 2 (2018) | Yes, #3 | sequel | $200m | The Incredibles' mom takes the spotlight while dad does the parenting |
| 10 | True Lies (1994) | Yes, #3 | remake | $115m | A spy husband's secret life collides with his marriage. |
10 story factors; spectacle pays most
Factor analysis (varimax) on the 46 story codes. Odds ratios are per SD of factor score, within year. As with the songs, the factors predict a little less well than the raw codes (AUC 0.729 vs 0.802). Open a factor to see the films at each end.
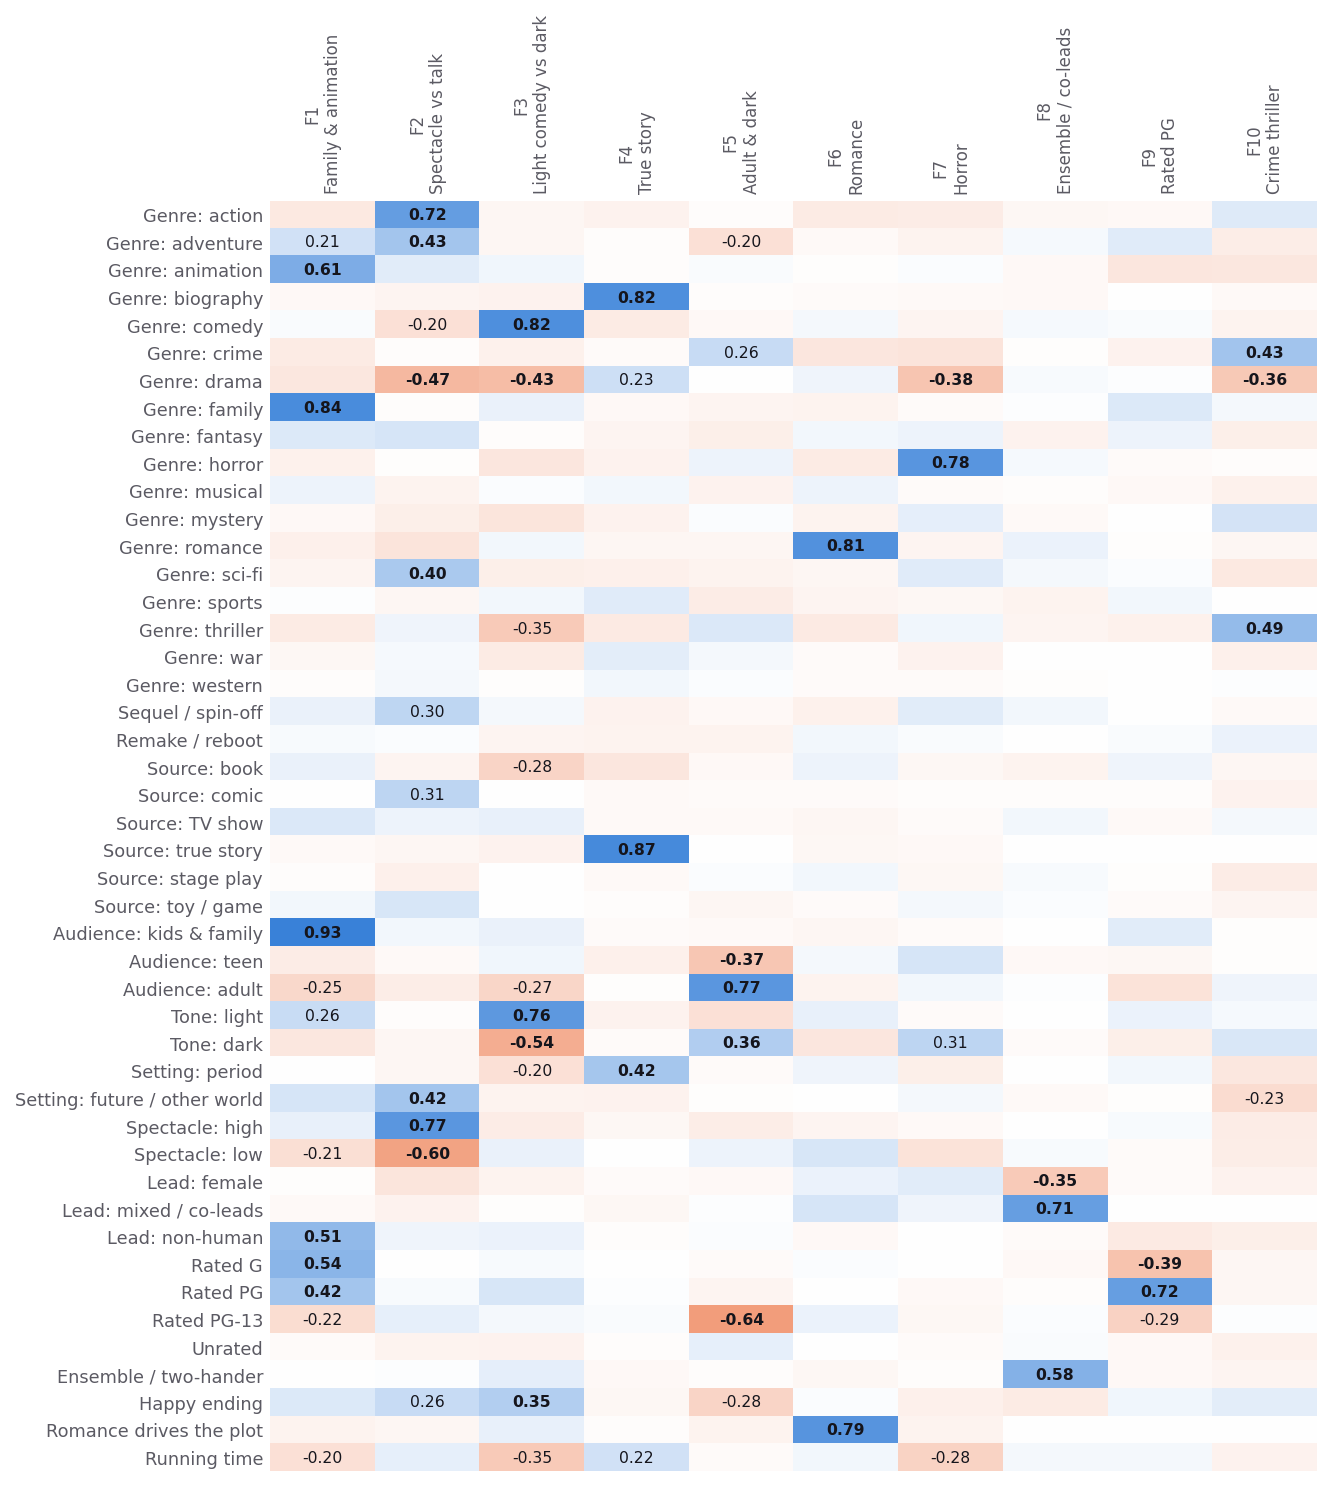
F1 Family & animation · odds ×1.34 · kids & family audience, animation, rated G, non-human lead
High end
- Balto (1995)
- The Tigger Movie (2000)
- The Chipmunk Adventure (1987)
- Tom and Jerry: The Movie (1993)
- Care Bears Movie II: A New Generation (1986)
- The Pebble and the Penguin (1995)
- The Care Bears Movie (1985)
- The Secret of NIMH (1982)
Low end
- Superman III (1983)
- Ant-Man (2015)
- Men in Black (1997)
- Men in Black 3 (2012)
- Men in Black II (2002)
- Men in Black: International (2019)
- Bulletproof Monk (2003)
- The Return of Swamp Thing (1989)
F2 Spectacle vs talk · odds ×2.0 · effects-driven action and adventure vs low-key drama
High end
- Avengers: Endgame (2019)
- Black Panther (2018)
- Valerian and the City of a Thousand Planets (2017)
- Aquaman (2018)
- Batman Forever (1995)
- Oblivion (2013)
- Thor: The Dark World (2013)
- Star Wars: Episode II - Attack of the Clones (2002)
Low end
- My Girl (1991)
- Because of Winn-Dixie (2005)
- War of the Buttons (1995)
- Sylvester (1985)
- Flowers in the Attic (1987)
- Russkies (1987)
- My Father's Glory (1991)
- A Dog's Purpose (2017)
F3 Light comedy vs dark · odds ×1.18 · comedy, light tone, happy ending
High end
- Personal Services (1987)
- Private Parts (1997)
- Tag (2018)
- Nacho Libre (2006)
- Action Point (2018)
- Mike and Dave Need Wedding Dates (2016)
- South Park: Bigger, Longer & Uncut (1999)
- The Informant! (2009)
Low end
- The Lovely Bones (2010)
- The Prestige (2006)
- Flowers in the Attic (1987)
- A.I. Artificial Intelligence (2001)
- Hugo (2011)
- The Woman in Black (2012)
- Lust, Caution (2007)
- The Great Gatsby (2013)
F4 True story · odds ×0.96 · biopics and period true stories
High end
- Battle of the Sexes (2017)
- In Love and War (1997)
- Eddie the Eagle (2016)
- Secretariat (2010)
- Wyatt Earp (1994)
- Miracle (2004)
- Rush (2013)
- The World's Fastest Indian (2006)
Low end
- Abandon (2002)
- Siesta (1987)
- The Circle (2017)
- Before I Fall (2017)
- Enemy (2014)
- La Cérémonie (1996)
- The Deep End (2001)
- Out of Blue (2019)
F5 Adult & dark · odds ×0.71 · adult audience, R-leaning, darker endings
High end
- Ghost in the Shell (1996)
- I Love You Phillip Morris (2011)
- Man Bites Dog (1993)
- Mind Game (2005)
- Batman: The Killing Joke (2016)
- Twin Town (1997)
- The Personals (1982)
- Turbo Kid (2015)
Low end
- Before I Fall (2017)
- The Boy (2016)
- The Circle (2017)
- You Got Served (2004)
- Body Rock (1984)
- The Uninvited (2009)
- Nerve (2016)
- Flowers in the Attic (1987)
F6 Romance · odds ×1.0 · romance drives the plot
High end
- The Little Mermaid (1989)
- Anastasia (1997)
- Howl's Moving Castle (2005)
- Aladdin (1992)
- The Princess and the Frog (2009)
- Pocahontas (1995)
- Corpse Bride (2005)
- Tarzan the Ape Man (1981)
Low end
- Varsity Blues (1999)
- Win Win (2011)
- Mystery, Alaska (1999)
- Dope (2015)
- With Honors (1994)
- ATL (2006)
- Staying Together (1989)
- Kikujiro (2000)
F7 Horror · odds ×0.82 · horror, dark tone, shorter running time
High end
- Silent Hill: Revelation (2012)
- Red Riding Hood (2011)
- Paranormal Activity 4 (2012)
- One Missed Call (2008)
- Ouija (2014)
- Prom Night II (1987)
- The Grudge (2004)
- Shutter (2008)
Low end
- Red Cliff (2009)
- The Green Mile (2000)
- The Last Samurai (2003)
- Drishyam (2015)
- State of Play (2009)
- The Shawshank Redemption (1994)
- The Man in the Iron Mask (1998)
- SuperFly (2018)
F8 Ensemble / co-leads · odds ×1.07 · two-handers and ensembles over one lead
High end
- Scooby-Doo 2: Monsters Unleashed (2004)
- Turbo: A Power Rangers Movie (1997)
- Mighty Morphin Power Rangers: The Movie (1995)
- Bumblebee (2018)
- Star Wars: Episode VIII - The Last Jedi (2017)
- SpaceCamp (1986)
- The Brady Bunch Movie (1995)
- Star Trek Beyond (2016)
Low end
- Quest for Camelot (1998)
- The Little Mermaid (1989)
- Thumbelina (1994)
- Rainbow Brite and the Star Stealer (1985)
- Anastasia (1997)
- Maid to Order (1987)
- The Last Unicorn (1982)
- Maxie (1985)
F9 Rated PG · odds ×1.06 · the PG rating itself
High end
- Life of Pi (2012)
- Greystoke: The Legend of Tarzan, Lord of the Apes (1984)
- A Passage to India (1985)
- The Right Stuff (1984)
- Gettysburg (1993)
- The Chronicles of Narnia: Prince Caspian (2008)
- Contact (1997)
- Percy Jackson & the Olympians: The Lightning Thief (2010)
Low end
- Bugs Bunny's 3rd Movie: 1001 Rabbit Tales (1982)
- Rugrats in Paris (2000)
- The Chipmunk Adventure (1987)
- Alvin and the Chipmunks: Chipwrecked (2011)
- Tom and Jerry: The Movie (1993)
- Cats Don't Dance (1997)
- Fantasia 2000 (2000)
- Winnie the Pooh (2011)
F10 Crime thriller · odds ×1.04 · crime and thriller vs drama
High end
- The Getaway (1994)
- Miss Bala (2019)
- Suspect (1987)
- The Sweeney (2013)
- Dead Man Down (2013)
- D.O.A. (1988)
- The Girl with the Dragon Tattoo (2011)
- Wind River (2017)
Low end
- Metropolis (2002)
- The Congress (2014)
- The Lion King (2019)
- Nausicaä of the Valley of the Wind (1987)
- The Lego Movie (2014)
- Logan (2017)
- A Scanner Darkly (2006)
- Bicentennial Man (1999)
Twelve kinds of film; the serious adult drama is the hardest sell
Gaussian-mixture clusters on the factor scores. Lift compares each archetype's hit rate with films from the same years. The archetype audiences love most, serious adult drama, hits at 0.37× its share, even though a higher IMDb rating raises any film's odds (×2.94 per SD, with hindsight). The box office rewards reach, and the rating rewards craft.
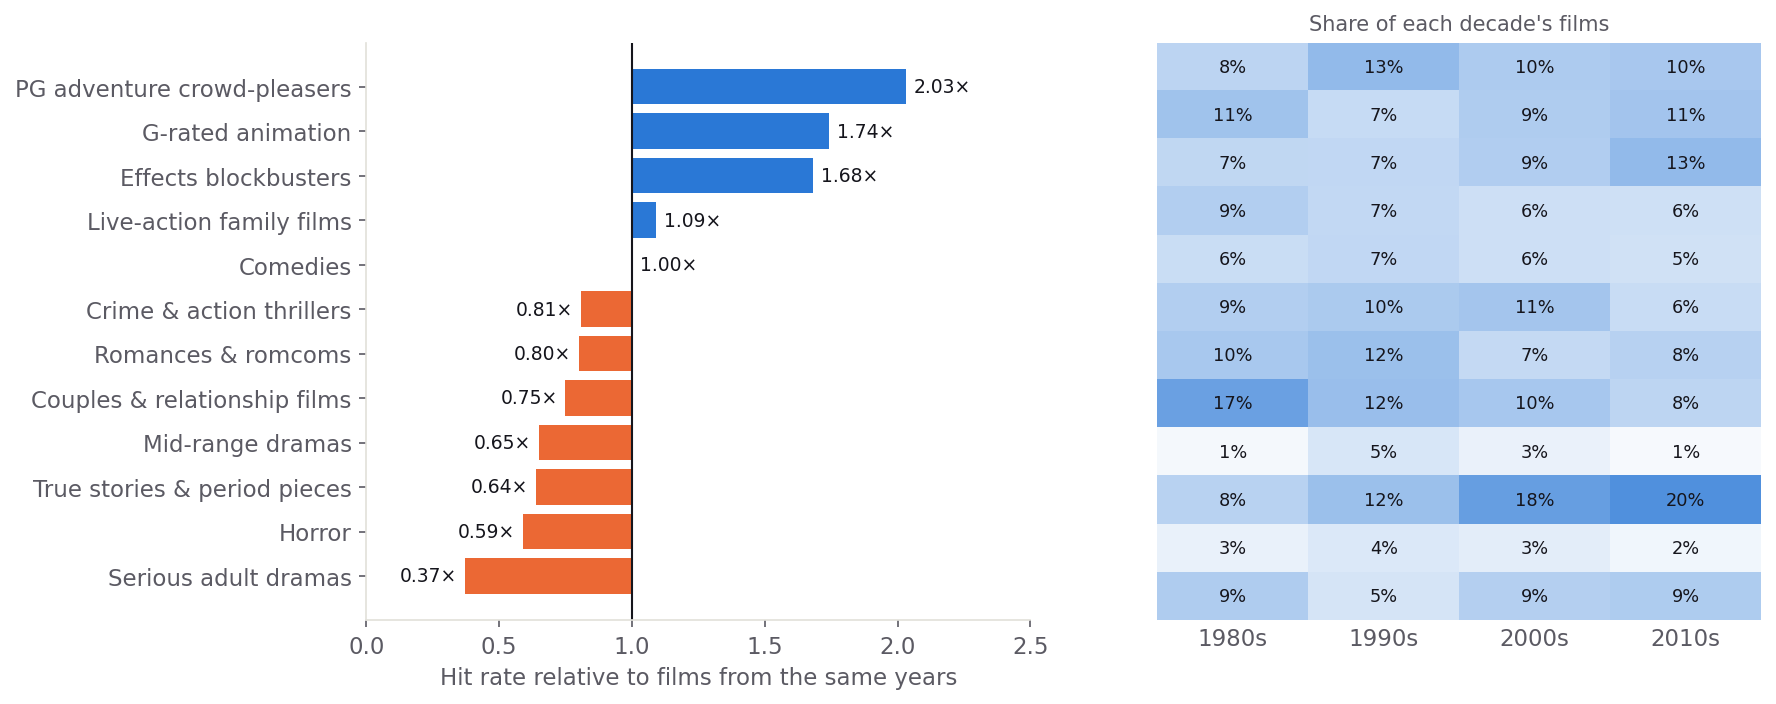
| Archetype | Avg year | Films | Lift | Best-known |
|---|---|---|---|---|
| PG adventure crowd-pleasers | 2001 | 534 | 2.03× | Star Wars: Episode V - The Empire Strikes Back; Back to the Future; Star Wars: Episode VI - Return of the Jedi; The Truman Show |
| G-rated animation | 1998 | 201 | 1.74× | WALL·E; Finding Nemo; The Lion King; Toy Story |
| Effects blockbusters | 2003 | 985 | 1.68× | The Dark Knight; Inception; The Lord of the Rings: The Return of the King; The Lord of the Rings: The Fellowship of the Ring |
| Live-action family films | 1998 | 166 | 1.09× | Home Alone; Home Alone 2: Lost in New York; The Goonies; Finding Neverland |
| Comedies | 1997 | 782 | 1.00× | The Big Lebowski; The Hangover; Ted; Superbad |
| Crime & action thrillers | 1999 | 622 | 0.81× | Se7en; Memento; V for Vendetta; Kill Bill: Vol. 1 |
| Romances & romcoms | 1999 | 602 | 0.80× | Forrest Gump; Good Will Hunting; Slumdog Millionaire; Amélie |
| Couples & relationship films | 1999 | 418 | 0.75× | Eternal Sunshine of the Spotless Mind; Silver Linings Playbook; The Notebook; La La Land |
| Mid-range dramas | 1998 | 458 | 0.65× | Million Dollar Baby; Arrival; Juno; Rain Man |
| True stories & period pieces | 2003 | 610 | 0.64× | Schindler's List; The Wolf of Wall Street; Goodfellas; Braveheart |
| Horror | 2001 | 625 | 0.59× | The Silence of the Lambs; Black Swan; Aliens; World War Z |
| Serious adult dramas | 2000 | 684 | 0.37× | The Shawshank Redemption; Fight Club; Pulp Fiction; Inglourious Basterds |
Films are far easier to call than songs
Both studies use the same design. Songs are cheap to make and compete on sound; films are expensive, and most of the bet is placed before anyone sees them.
| Songs (1960–2010) | Movies (1980–2019) | |
|---|---|---|
| Hit rate | 23.1% | 22.2% |
| Within-year AUC | 0.65 | 0.86 |
| Top / bottom decile hit rate | 46.1% / 8.5% | 78.5% / 0.7% |
| Strongest predictor | Artist's previous top-10 hits | Budget |
| The product alone | 0.62 (sound + genre) | 0.80 (story codes) |
| Verdict | No formula. An entry ticket. | Not a formula. A business model. |
The Choice Engine
Pick a film you love, and the engine ranks every other film by how much someone who loves it would value them. It uses a quadratic consumer-surplus score whose shadow prices come from the hit model, with plain cosine similarity alongside as a baseline. A switch adds the business side (budget, studio, release window, track record), and an era dial favours films from the reference's years. Every card shows a synopsis, a logline and hit-signal chips.
Open the Choice Engine →